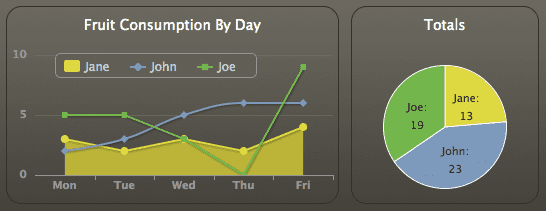
In previous projects at MailChannels I have used Flot.js for graphing. There were many reasons I chose this originally. The graphs are interactive and can be manipulated within the browser without having to communicate back to the server. You can retrieve additional data from the server which enables you to be able to scan left and right on graph. You can animate transitions, zoom in and out, get the values at precise points on the graph and select an area data. When I found Flot.js I was mainly looking for something that was not ugly. I was using Perl on the server side, and Perl has a history of having ugly graphing solutions. I’ve since found some alternatives on the Perl side, but for me Flot.js was the new hotness at that time. You can read my presentation on Graphs In Perl and Flot.js over at slideshare.
So Flot.js is pretty cool, but what are it’s limitations? The number one limitation is the ability to render a graph anywhere other than within the browser. Since JavaScript is creating the graph it’s hard to automate emailing a static PNG/JPG/GIF image of the graph from the server without firing up a browser and then taking a snapshot.
Enter Highchart.
I discovered Highchart recently while working with netSIGN. We were looking at graphing options in Ruby On Rails and came across Highchart. It’s much like Flot.js, but it is a commercial venture. Flot.js is free; released under the MIT license and is sponsored by IOLA in Denmark. Developers on a shoe-string are unlikely to look at Highchart, just because of price tag, but for most projects I think the price it reasonable. What do you get for your money?
Documentation
Highchart feels more polished than Flot.js and many of the standard features, simply work out of the box. Flots basic chart is very basic and you have to pass all the options to get something that starts to look nice. Maybe you prefer that though. Finding those options is so much nicer with Highcharts’ Options Reference. It’s easy to drill down and see exactly how the options piece together through the hierarchical menu. I do not want to knock Flot.js, since it does have documentation, but it is written more like a novel than the reference document and referring to it is time consuming.
Rendering Offline
“Wow!”, was all I could think when I saw that Highchart can actually render the graphs on the server as PNG files. Ok, it’s not a perfect solution and still requires a web-browser, but as long the user is viewing the graph, a copy of the graph can be sent to the server for generation as a PNG or other file format.
How does it do it? The JavaScript in the browser generates SVG, which the browser can render visually. Highchart simply passes that generated SVG back, from the browser, to the server. The server then takes the SVG file and passes it to SVG Rasterizer, which is an Apache Project. It’s a Java program that can be called to follows
java -jar batik-rasterizer.jar graph.svgLimitations
The main limitation with both Flot.js and Highchart is that of generating offline reports. Even though Highchart gets further down the road, it cannot be done without first rendering the graph in the browser. I have not investigated, but I have a feeling that you could do this if you have a server that can run JavaScript code, such as node.js.
Conclusion
Yes, there is a cost, but I think it’s worth going with Highchart. Flot.js has not evolved much in the time I’ve known it and I think Highchart is a more mature product and is quicker to get up and running with. If you are a commercial venture (Highchart is free for non-commercial) and you do not want to spend a penny then Flot.js is still a great solution and I would not dissuade anyone from using it.

If you are using Java for HTTP server you might be able to integrate it with rhino https://www.mozilla.org/rhino/ and SVG Rasterizer
It’ll be great if you can show an example of highcharts with perl.
Thanks
have you tried wkhtmltopdf? and wkhtmltoimage?
I have tried both of these and they work very well. An example of wkhtmltopdf with flot.js, that I worked on, can be seen to you download PDF reports from gtmetrix.com
Highchart is free o.O
https://www.highcharts.com
-Chris
Hi Chris. Only for a personal or non-profit project. A single website license is $80.
Yeah it’s free to download and to use.
Have you tried jqplot – https://www.jqplot.com/?
For automated reports what I do is running PhantomJS (or casperJS) which are headless browsers and then just create the charts.
Casper is based on PhantomJS, and PhantomJS works on node, that’s something you could use for offline reporting.